Vertical Extrapolation of Wind Speed
A wind turbine produces electrical power by harnessing wind within the atmospheric boundary layer. Wind speed within the boundary layer increases with height. In order to take a wind speed at a reference height of, for example, 10m, and extrapolate this to the hub height of a particular wind turbine, the following laws can be used: the ‘Log Law’ and the ‘Power Law’.
It should be noted that wind speed with respect to height is affected by atmospheric stability, surface roughness, changes in surface conditions and terrain shape. The use of the expressions below are a simplified method of extrapolating wind speed where only one measured mean wind speed is known at a known reference height.
Using the Power Law to Extrapolate Mean Wind Speed

Where:
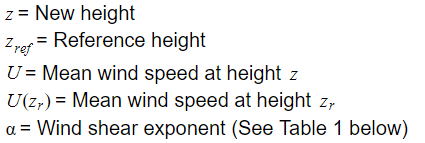
The wind shear exponent varies with the terrain. The following table provides reference values for wind shear exponent with respect to different types of terrain:
| Terrain | Wind shear exponent |
| Open water | 0.10 |
| Smooth, level, grass-covered | 0.15 |
| Row crops | 0.20 |
| Low bushes with a few trees | 0.20 |
| Heavy trees | 0.25 |
| Several buildings | 0.25 |
| Hilly mountainous terrain | 0.25 |
Table 1: Wind shear exponent values (approximates) for various types of terrain (Engineeringtoolbox.com , 2020)
Using The Log Law to Extrapolate Mean Wind Speed

Where:
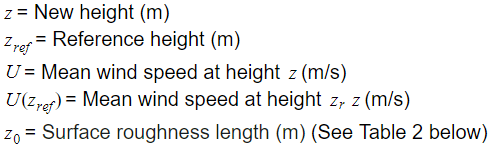
| Terrain | Surface Roughness |
| Very smooth, ice or mud | 0.01 |
| Calm open sea | 0.20 |
| Blown sea | 0.50 |
| Snow surface | 3.00 |
| Lawn grass | 8.00 |
| Rough pasture | 10.00 |
| Fallow field | 30.00 |
| Crops | 50.00 |
| Few trees | 100.00 |
| Many trees, hedges, few buildings | 250.00 |
| Forest and woodlands | 500.00 |
| Suburbs | 1500.00 |
| Centres of cities with tall buildings | 3000.00 |
Table 2: Surface roughness length (approximates) for various types of terrain (Source: Wind Energy Explained (2009))
The Vertical Extrapolation of Weibull Distribution Parameters (k and c)
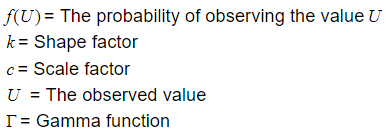
As mentioned in in a different guide (See here), the curve produced by a wind speed distribution can be approximated using a Weibull distribution.The Weibull distribution is a continuous probability distribution with the following expression:
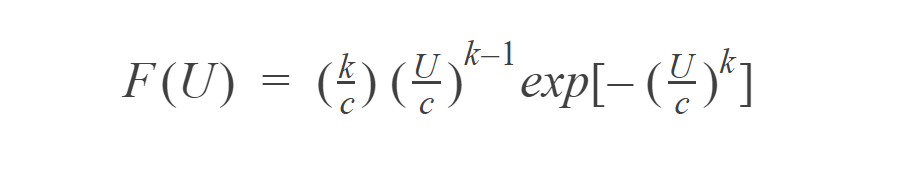
Where:
The following image shows a fitted Weibull curve over the top of a measured wind speed distribution:
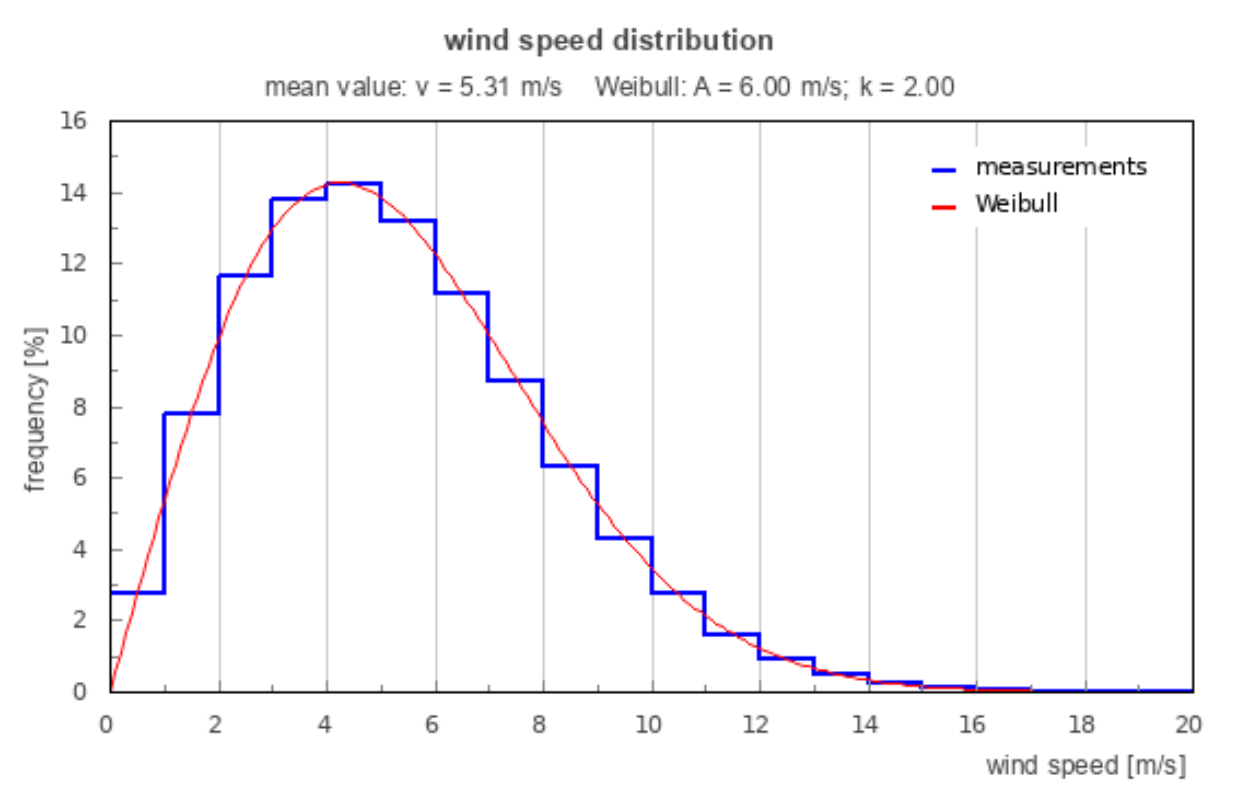
Using measured wind speed data at your reference height, it is possible to calculate parameters k and c. However, if a planned turbine has a hub height of higher than your reference height, parameters k and c will need to be extrapolated.
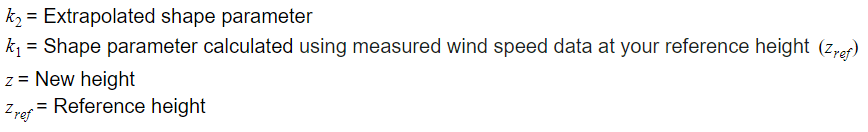
Extrapolation of Shape Parameter (k)
Where:
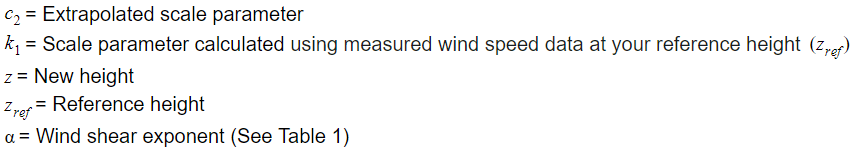
Extrapolation of Scale Parameter (c)

Where: