How To: Interpret a Wind Rose Diagram
A wind rose diagram is a tool which graphically displays wind speed and wind direction at a particular location over a period of time. The diagrams normally comprises of 8, 16 or 32 radiating spokes, which represent wind directions in terms of the cardinal wind directions (North East South West) and their intermediate directions.
Meteorologist use wind rose diagrams to summarise the distribution of wind speed and direction over a defined observation period. Data is taken from a weather station, which should be a near as possible to your project /site. Click here to find an appropriate weather station.
What do the Spokes Represent?
Each ‘Spoke’ shows:
- How often the wind blows from each direction
- How often the wind blows within each pre-defined wind speed range (bins). This is shown by the colour bands on each spoke.
A wind rose diagram uses a polar coordinate system, whereby data is plotted a certain distance away from the origin at an angle relative to north.
It is possible to create these plots using costly purpose-made software or, alternatively, very basic wind rose diagrams can be made using Microsoft Excel (see here). Wind Rose Excel also provides 2 paid options:
- WRE Web App – allows users to fetch data from 30,000 different weather stations and create wind rose diagrams within a web application. Click here for more information.
- WRE v1.7 – allow users to copy their own data into a macro-enabled excel workbook in order to produce wind rose diagrams. Click here for more information.
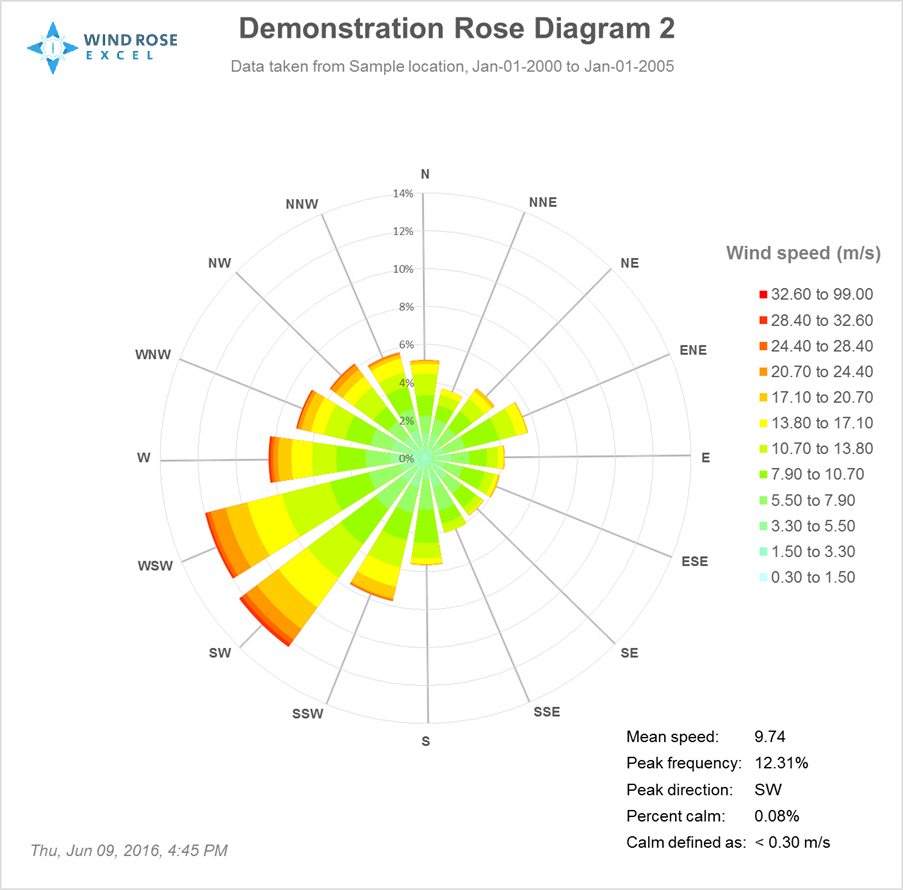
Interpreting an Example Wind Rose Diagram
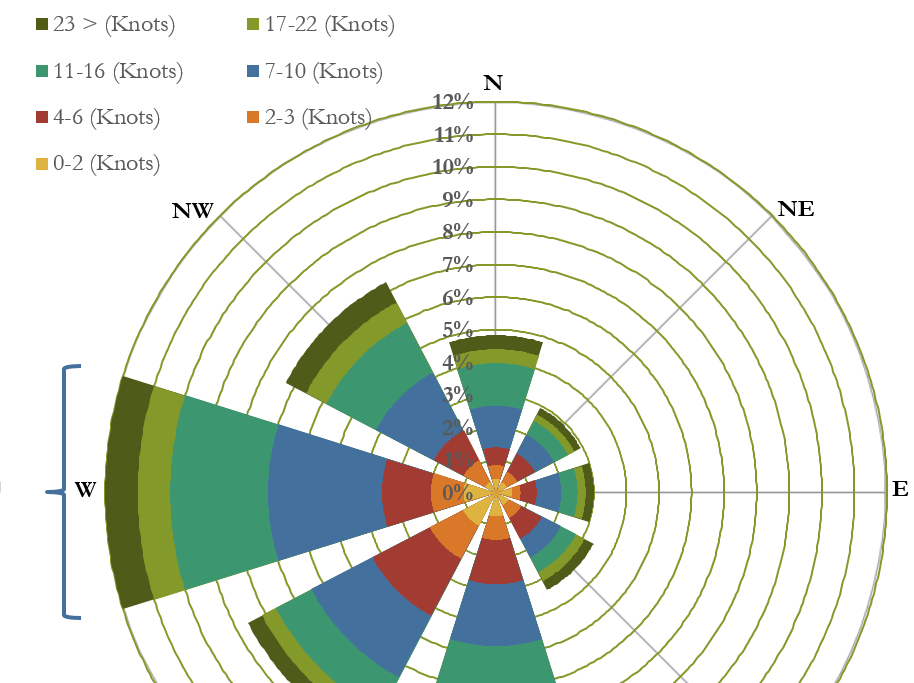
In Diagram 1 the westerly spoke and its colour bands provides the following information:
- The wind blows from the west (a “westerly”) 12% of the time at location x
- Westerly wind speed distribution for location x:
- 1% of total time the wind blows at 0-2 knots from the west
- 1% of total time the wind blows at 2-3 knots from the west
- 1.5% of total time the wind blows at 4-6 knots from the west
- 3.5% of total time the wind blows at 7-10 knots from the west
- 3% of total time the wind blows at 11-66 knots from the west
- 1% of total time the wind blows at 17-22 knots from the west
- 1% of total time the wind blows at >23 knots from the west
What is Possible using Excel?
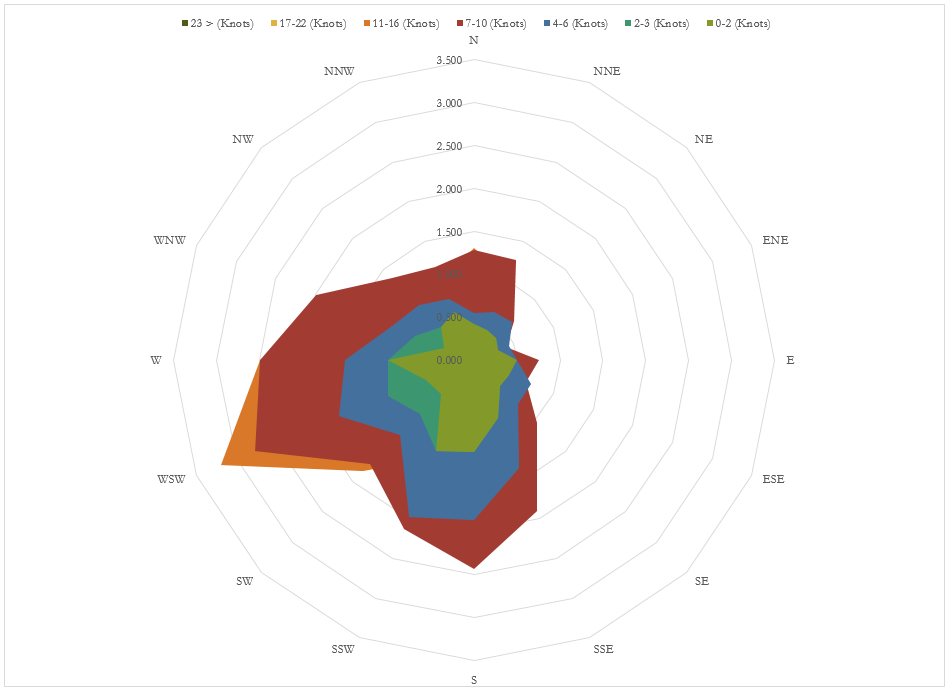
When presented with the data required to make a wind rose, the best excel can do is produce a radar plot as shown by Diagram 2. It is worth noting that it takes considerable time to create a wind rose in excel. We estimate that it will take an experienced excel user between 2 and 3 hours to create a wind rose as shown in Diagram 2. This is because the data needs to be adjusted in various ways to enable the “Filled Radar Plot” to accurately present the data.
It is not possible to create the radial ‘spokes’ that are industry standard for wind rose diagrams. In order to produce spokes, WRE v1.7 is uses VBA coding. The code also automated the process of creating the wind rose plots, saving considerable time.
What is Possible using the WRE Web App?
The video below is a very simple run through of the following:
- Fetching data from a random location in the world
- Creating a customised wind rose diagram
- Sharing your wind rose diagram.
Click here for pricing information
What is Possible using WRE v1.7?
- The software transforms the layout of the standard excel radar plot into a succinct graphical design.
- The diagrams have correctly labelled radial guide lines and spokes, adding credibility to your report writing.
- The time taken to produce each diagram is reduced to a matter of minutes
- Included in the new WRE 1.7 package is a data sorting tool. This will guide you through the process of sorting your data into wind speed bins and wind directions (see more info here).
- We have been selling Wind Rose software for the last 8 years. We are able to answer any questions you have in our support forum once you have purchased the software.
- We provide the most complete, cost-effective solution on the market.
Click here for pricing information